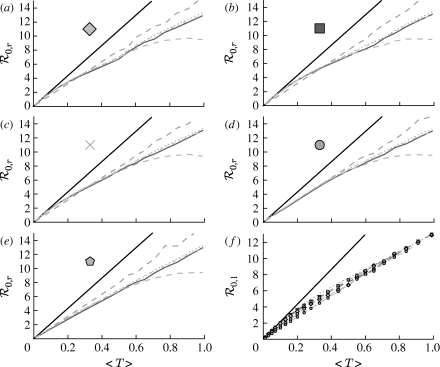
Figure 8.
(a–e)  calculated from EPNs for the heterogeneous examples of table 1 (black solid curve, unclustered
  0; black dashed curve,
  0,0; grey solid curve,
  0,1; dotted curve,
  0,2; dot-dashed curve,
  0,3; grey dashed curve,
  0,4). (f)
  0,1 values for all of the different cases, including both unclustered
  0 (solid curve) and homogeneous
  0,1 (dotted curve) are compared.

