
Table 1.
For the calculations of §§4 and 5, we determine Tuv using equations (2.1) and (2.2) with the distributions of  and
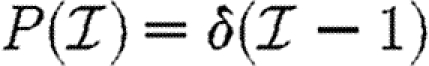
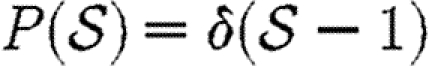
and  given in the first four rows, or by considering a maximally heterogeneous population for which 〈T〉 of the population infects all neighbours and 1−〈T〉 infects no neighbours. (The function δ is the Dirac delta function.)
| symbol | infectiousness | susceptibility |
|---|---|---|
 |
 |
 |
 |
 |
 |
 |
 |
 |
 |
 |
 |
 |
maximally heterogeneous 
|
homogeneous Tin=〈T〉 |