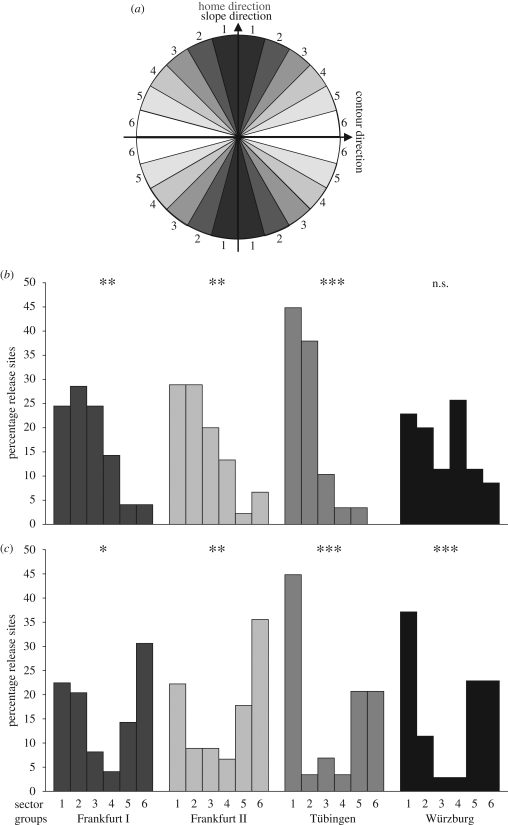
Figure 2.
Sector analyses of ΔH and ΔM values. (a) Division of a circular diagram into six sector groups with each group encompassing 60°. For analysis of ΔH (mean vanishing direction in relation to HD), HD was standardized as 0° for each release site. For analysis of ΔM (mean vanishing direction in relation to the direction of the steepest magnetic field intensity slope at the point of vanishing), slope and contour directions were standardized as y- and x-axes, respectively. Percentage of (b) ΔH and (c) ΔM values that fell in each of the six sector groups defined in figure 2a for the four datasets. Significance levels for χ2 goodness-of-fit test testing the null hypothesis of equal distribution of ΔH and ΔM values across all six sectors: *p < 0.05, **p < 0.01, ***p < 0.001, n.s., not significant.

