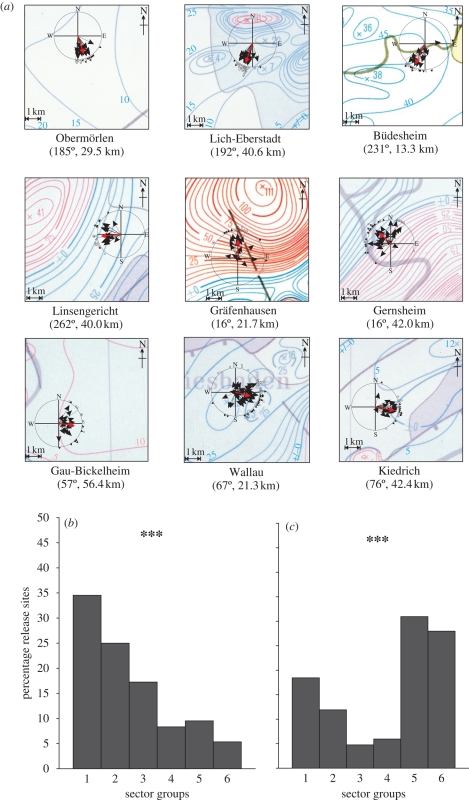
Figure 3.
(a) Circular distribution of mean vanishing bearings of individual releases for nine release sites (fig. 7 in Wiltschko 1992) transposed onto an aeromagnetic map showing magnetic field intensity contour lines at 5 nT intervals (pink and blue lines indicating deviations above and below the Earth's background field, respectively; all other lines not relevant to the current analysis). HD and distance from loft are listed below the panel for each site. Circles scaled to represent typical 2 km vanishing distance. Mean vanishing vectors for individual releases from each site: black arrows inside circle. Vanishing directions: symbols on circle's circumference (solid triangle, mean vanishing bearing showing a statistically significant bias; open triangle, mean vanishing bearing homeward orientated; open circle, mean vanishing bearing not significant according to Rayleigh test). HD, dashed line; median second-order vanishing vector (table 4 in Wiltschko 1992), bold red arrow. Sector analyses of (b) ΔH and (c) ΔM values combined for all individual releases from nine sites (fig. 7 in Wiltschko 1992). Only significantly oriented mean vanishing vectors (Rayleigh test) were included in this analysis. Percentage of (b) ΔH and (c) ΔM values that fell in each of the six sector groups defined in figure 2a. Significance levels for χ2 goodness-of-fit test testing the null hypothesis of equal distribution of ΔH and ΔM values across all six sectors: *p < 0.05, **p < 0.01, ***p < 0.001, n.s., not significant.

