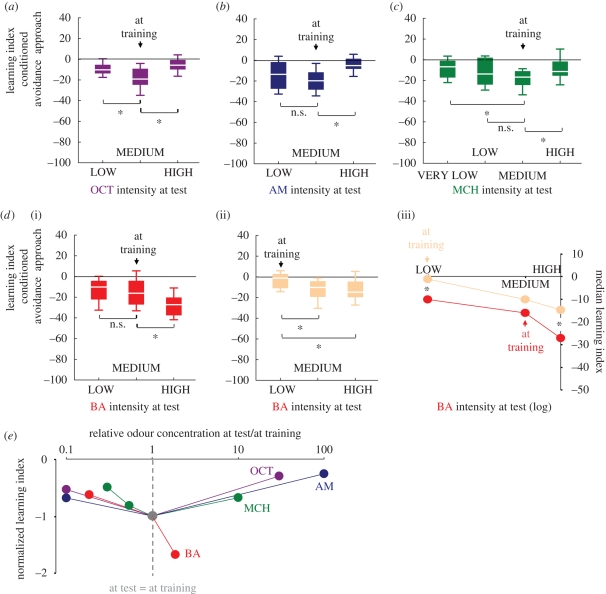
Figure 4.
Intensity learning for OCT, AM and MCH but not for BA. Statistics refer to U tests. n.s.: p > 0.05/2, *p < 0.05/2, except in (c) and (d(iii)), where n.s.: p > 0.05/3, *p < 0.05/3. Other details as in the legend of figure 3. (a) Having been trained with a MEDIUM intensity of OCT, flies showed the strongest conditioned avoidance when offered the same MEDIUM intensity at test (MEDIUM versus LOW: U = 107.00, p < 0.05/2; MEDIUM versus HIGH: U = 72.00, p < 0.05/2, n = 20, 20, 20). (b) Similarly, after training with a MEDIUM intensity of AM, the same MEDIUM intensity induced stronger conditioned avoidance than a HIGHer intensity (U = 96.00, p < 0.05/2). Conditioned avoidance did not statistically differ between LOW and MEDIUM (U = 189.00, p = 0.23). Sample sizes are n = 20, 24, 24. (c) Also, having been trained with a MEDIUM intensity of MCH, flies showed stronger conditioned avoidance to this intensity as compared to a VERY LOW (U = 147.00, p < 0.05/3) or HIGH intensity (U = 159.00, p < 0.05/3). The adjacent LOW intensity induced as strong conditioned behaviour as MEDIUM (U = 290.00, p = 0.16). Sample sizes are n = 24, 31, 24, 24. (d(i)) Despite having been trained with a MEDIUM intensity of BA, flies showed stronger conditioned avoidance to the HIGH intensity at test (U = 492.00, p < 0.05/2); conditioned avoidance to MEDIUM and LOW did not differ statistically (U = 1030.00, p = 0.37). Sample sizes are n = 48, 48, 40. (d(ii)) Similarly, although they were trained with a LOW intensity of BA, flies avoided both the MEDIUM (U = 220.00, p < 0.05/2) and the HIGH intensity (U = 199.00, p < 0.05/2) more strongly at test. Sample sizes are n = 32, 24, 24. (d(iii)) The median learning indices from (d(i,ii)) are plotted on a truncated y-axis against a logarithmic scale for BA intensity at test. Under the conditions of LOW testing intensity, a MEDIUM training intensity supported stronger BA memories than a LOW training intensity (U = 364.00, p < 0.05/3). Also, learning scores uncovered by the HIGH testing intensity were lower after training with LOW than after training with MEDIUM (U = 177.00, p < 0.05/3). (e) Semi-schematic summary of the data in (a–d). With respect to each odour, we express the various relative concentrations used at test as multiplicative of the training concentration (i.e. multiplicative of the relative concentration designated as the MEDIUM intensity). These values are plotted on the x-axis using a logarithmic scale. Then, with respect to each odour, we take the median learning score obtained when MEDIUM training intensity is offered at test and define this as −1 (grey circle; by definition the same for all odours). All other median learning scores are then accordingly normalized and are plotted as ‘normalized learning indices’ on the y-axis. For OCT (purple), AM (blue) and MCH (green), the best learning scores are obtained when the relative odour concentration matches between training and test (dashed grey line), showing intensity learning for these odours. Contrarily, for BA (red), flies show the best learning score when the highest relative concentration is offered at test, arguing against intensity learning of BA.

