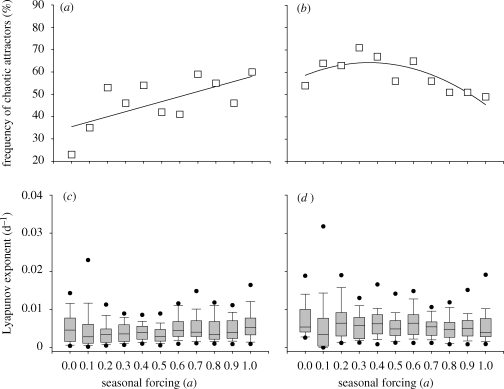
Figure 5.
(a,b) Relative frequency at which randomly generated model communities display chaos, plotted as a function of the amplitude of seasonal forcing. Results are shown for model communities grown at two productivities: (a) K = 5 mg l−1 and (b) K = 10 mg l−1. A linear regression line is fitted to the data in (a), and a quadratic regression to the data in (b). (c,d) Boxplots of the Lyapunov exponents of the chaotic communities, plotted as a function of the amplitude of seasonal forcing. Results are again shown for (c) K = 5 mg l−1 and (d) K = 10 mg l−1. Black dots represent the 5 and 95 percentiles. The results are based on 100 simulations for each level of seasonal forcing.

