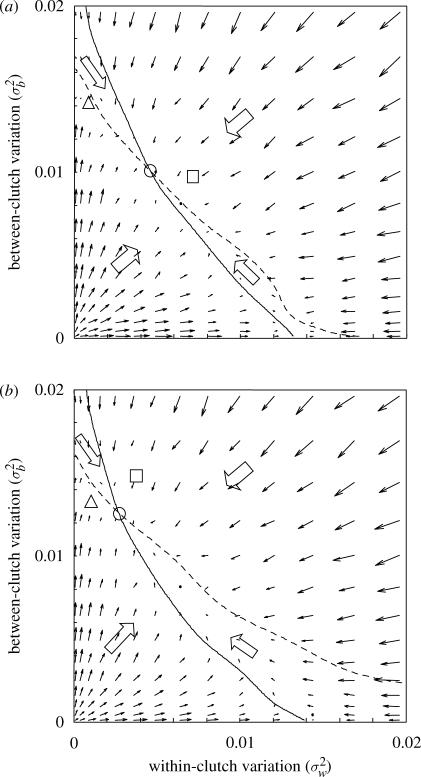
Figure 2.
The rate of evolutionary change of the two variation parameters σw and σb, i.e. within- and between-clutch variation, respectively. The arrows indicate the direction of the mean rate of change from 10 000 simulations of 10 time steps each. A long (short) arrow corresponds to quick (slow) evolution. The solid and dashed lines are the nullclines of σw and σb evolutionary rates, respectively. The block arrows represent the principal directions of evolutionary change in each region of parameter space. The nullclines intersect at a convergent stable evolutionary equilibrium (solid circle). Only the case of intermediate adult survival is fully shown, but the convergent stable strategies of low survival (s = 0.01, square) and high survival (s = 0.4, triangle) are also depicted. (a) Normal within-clutch distribution. (b) Uniform within-clutch distribution. See text for further model and simulation details.

