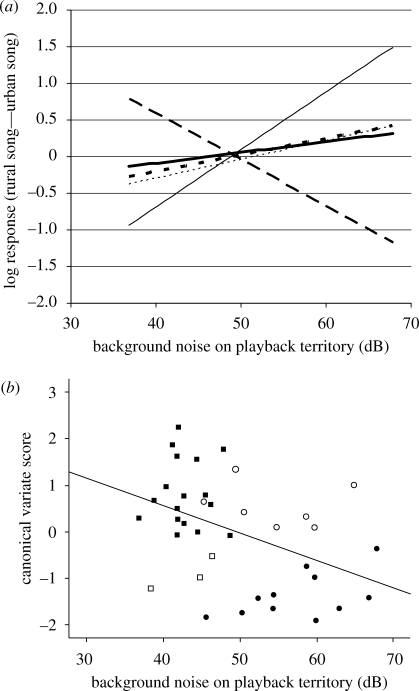
Figure 4.
(a) A graph showing the correlations of background noise with each of the five difference variables (Approach: thin solid line (r = 0.393, p = 0.015), the closest approach to the speaker; LatFly: dotted line (r = 0.275, p = 0.095), the latency to fly towards the speaker; LatOver: short dash line (r = 0.381, p = 0.018), the latency to overlap song with the tape; Within5: long dash line (r = −0.367, p = 0.023), the amount of time spent within 5 m of the speaker; Dormant: thick solid line (r = 0.410, p = 0.011), the amount of time spent not responding to the playback stimulus). The y-axis represents the difference in response to the rural and urban songs by an individual: a high value indicates a higher value in the rural response than the urban response. (b) A scattergraph showing the correlation between the canonical variate score and the background noise of the playback territory (r = −0.432, p = 0.007). Data points represent individual males; closed circles, urban birds; closed squares, rural birds. Empty shapes represent individuals that the model classified incorrectly (open circles, urban birds; open squares, rural birds).

