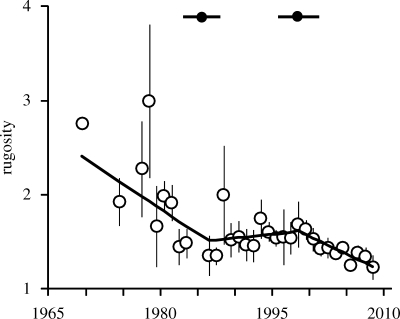
Figure 3.
Changes in reef rugosity on reefs across the Caribbean from 1969 to 2008. Black line represents the best fitting model—a segmented regression weighted by the number of sites contributing to each annual rugosity estimate (mean ± 95% confidence intervals). Black dots at the top of the figure indicate the significant breakpoint in 1985 and 1998 (±1 s.e.) for the segmented regression. Model slopes: 1969–1984, −0.054; 1985–1997, 0.008; 1998–2008, −0.038.

