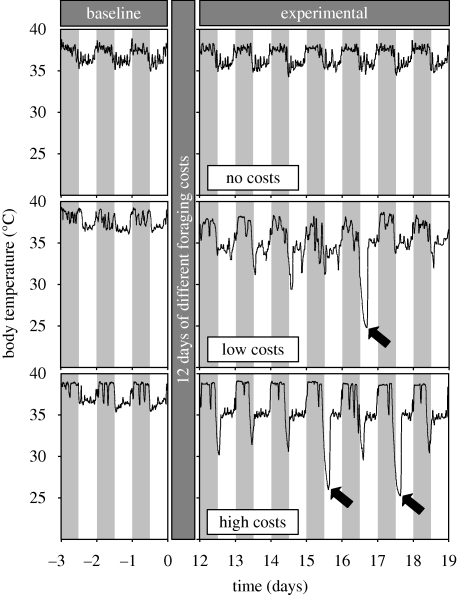
Figure 1.
Body temperature responses of female laboratory mice to variation in foraging conditions at an ambient temperature of 21 ± 1°C. Examples of one individual per treatment group are shown: no foraging costs given a food ration matched to the intake of high-cost animals (top panels), low foraging costs (middle panels) and high foraging costs (bottom panels). The figure shows part of the overall temperature record, where day 0 is the start of experimental manipulation. Shading shows the light–dark cycle, and black arrows highlight torpor bouts.

