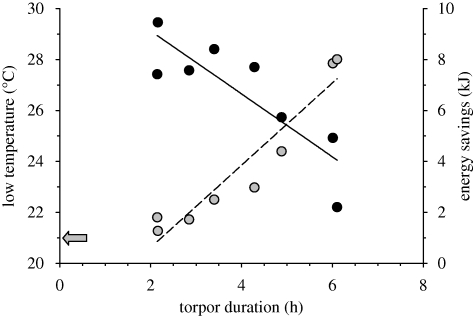
Figure 2.
Body temperature and estimated energy savings in relation to torpor duration. Data points are individual average low temperatures (black symbols and solid line; y = −1.24 × +31.60, R2 = 0.74, F1,6 = 16.67, p = 0.007) and energy savings (grey symbols and dashed line; y = 1.62 × −2.62, R2 = 0.90, F1,6 = 56.34, p = 0.0003). n = 8 because six animals did not show torpor. The grey arrow shows the ambient temperature of 21°C.

