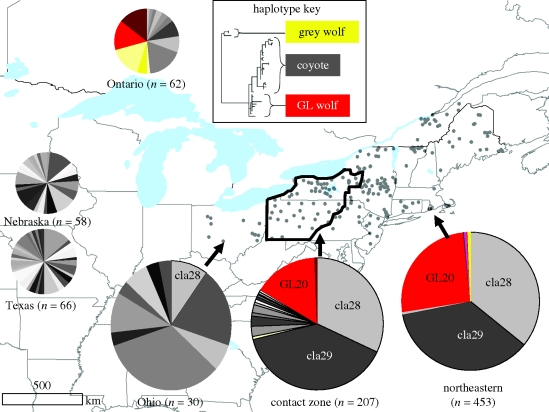
Figure 2.
Mitochondrial haplotype frequencies of eastern coyotes and source populations. Sampling localities from this paper are shown as grey dots and summarized as large pie charts showing the proportion of animals with haplotypes categorized according to their position on the phylogeny. Smaller pie charts show haplotype frequencies representative of the two source populations: Ontario wolves and coyotes (Wilson et al. 2000; Leonard & Wayne 2008) and coyotes from western states (Hailer & Leonard 2008).

