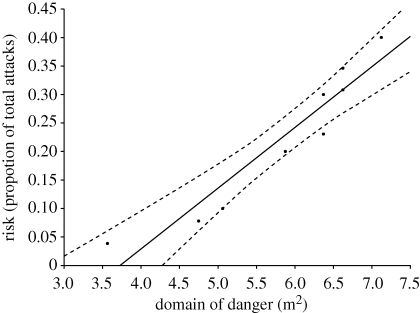
Figure 2.
The relationship between risk (proportion of total attacks) and domain of danger size (m2). We pooled results of domains of dangers from configurations of four (n = 10) and five (n = 26) individuals in this analysis and correlated it with the number of attacks experienced as a proportion of the total number of trials. Dashed lines represent the confidence interval at the 95 per cent level (p = 0.00008, n = 9, α = 0.05).

