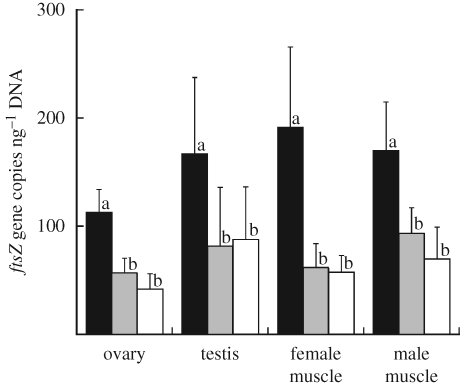
Figure 3.
Titres of the ftsZ gene in M. alternatus evaluated by quantitative PCR in terms of ftsZ gene copies per nanogram of total DNA in each sample. Solid columns show the adult individuals produced by the cross between a ftsZ+ male and a ftsZ+ female, shaded columns show those produced by the cross between a ftsZ− male and a ftsZ+ female, and open columns show those produced by the cross between a ftsZ+ male and a ftsZ− female. The means and standard deviations of 10 measurements are shown for the ovary, testis, female thoracic muscle and male thoracic muscle. Different letters (a and b) indicate statistically significant differences (Mann–Whitney U-test: p < 0.05 after Bonferroni correction).

