Figure 2.
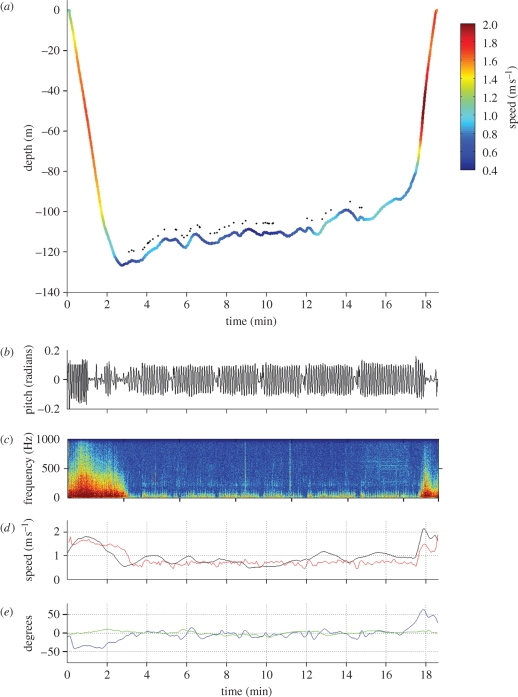
Bowhead whale foraging dive. (a) Dive profile showing the slow estimated speed in the bottom phase of the dive compared with the descent and ascent phases (colour bar). The dots indicate the time of recorded rattle-like sounds. (b) Cyclic variation in the pitch angle because of fluke strokes, indicating constant fluking during the bottom phase of the dive. (c) Spectrogram of the sound recording showing the higher levels of low frequency sound during the fast descent and ascent phases (fast Fourier transform (FFT) size 1024). (d) Speed estimated from the change in depth corrected for the pitch angle, filtered with a Kalman filter (black) and speed estimated from the low-frequency flow noise (red). (e) Pitch angle (blue) and roll angle (green).

