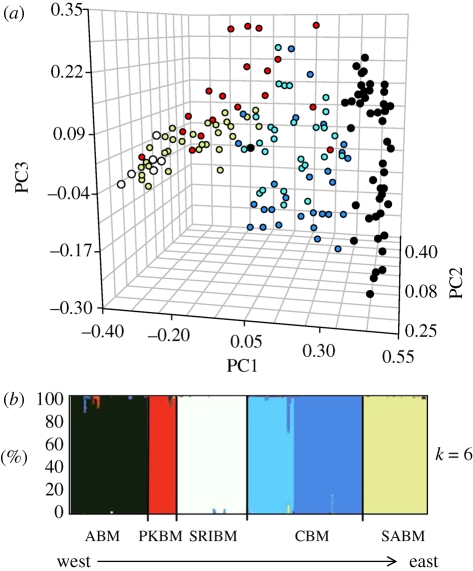
Figure 2.
Phenotypic and neutral genetic divergence in beach mice. (a) Three-dimensional scatter plot of a principal components analysis for 12 phenotypic traits among beach mouse subspecies. Each dot represents an individual (in some cases, dots overlap and therefore represent more than one individual) and is colour-coded by subspecies. Choctawhatchee beach mice (CBM) are represented as both light and dark blue corresponding to the two subgroups identified in (b). Sample sizes are provided. (b) Proportion of individuals assigned by Structure to clusters estimated from microsatellite data (with no prior membership information). Vertical coloured bars represent the proportion of an individual's membership in each of the six clusters, which correspond to the five subspecies. CBM (in blue) show two genetically distinct subgroups (n = 41); ABM in black (n = 42); SRIBM in white (n = 42); PKBM in red (n = 18); SABM in pale green (n = 39).

