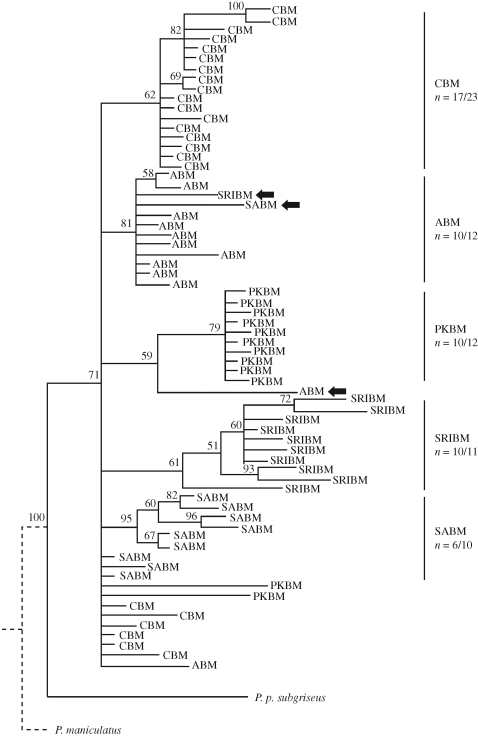
Figure 3.
Bayesian topology of 70 individuals (rooted with P. p. subgriseus and P. maniculatus) based on 2958 bp of mtDNA (ND3–COIII and control region) sequences and eight autosomal SNPs. Individuals are labelled by their sample site, and those that do not cluster with their population of origin are highlighted with an arrow. Subspecific clades are highlighted on the right with the number of individuals from that subspecies included in the clade of the total number sampled. Bayesian posterior probabilities for each node of ≥50 are shown.

