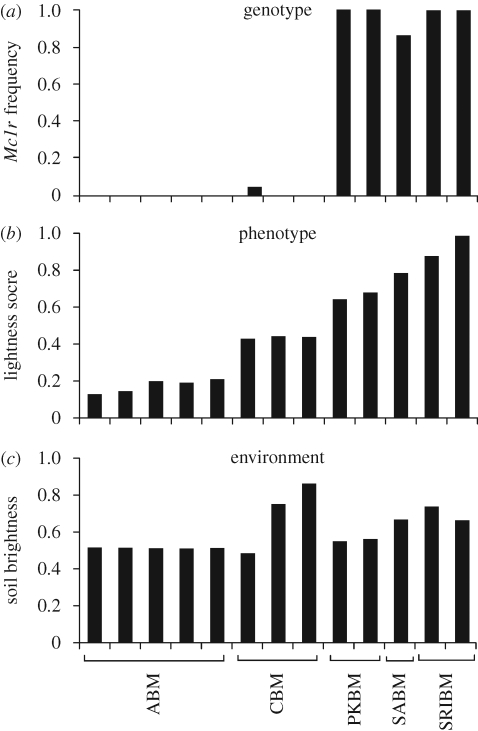
Figure 5.
Patterns of genetic, phenotypical and environmental variation across beach mouse subspecies. Each column represents a sampling site. Columns are arranged by phenotypic score (not by geographical location). (a) Frequency of the light allele of the Mc1r pigment gene. (b) Average lightness score of mice scaled from 0–1 (see text for details). (c) Average brightness of sand sample measured using a spectrophotometer.

