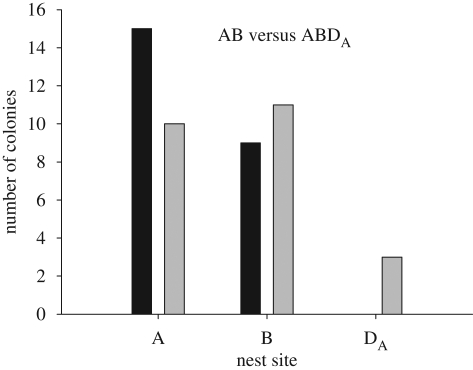
Figure 4.
Outcome of binary choices between A and B (black bars) and ternary choices between A, B and DA (grey bars). Bar heights show the number of colonies choosing each option at the end of the emigration. The addition of DA had no effect on the proportion of colonies choosing site A (McNemar test: χ12 = 1.45, n = 24, p = 0.23) or site B (McNemar test: χ12 = 0.13, n = 24, p = 0.72).

