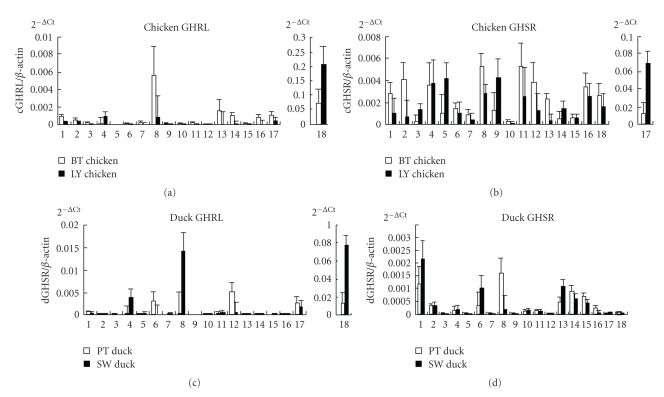
Figure 4.
Relative mRNA expression levels of the GHRL and GHSR genes in adult chicken and duck tissues. The vertical axis indicates the 2−Ct value (mean ± S.E.M., n = 6). Pituitary, Cerebrum, Lung, Abdominal fat, Liver, Testis, Gizzard, Subcutaneous fat, Spleen, Kidney, Leg muscle, Uropygial gland, Hypothalamus, Small intestine, Cerebellum, Heart, Breast muscle, and Proventriculus are considered.

