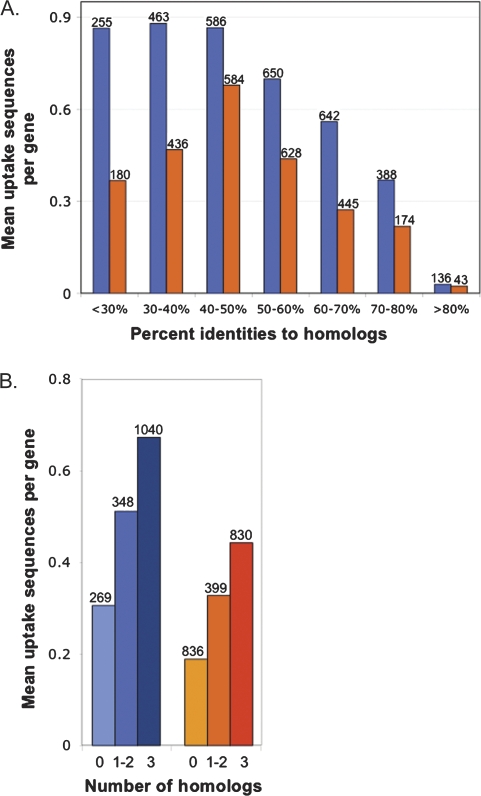
Fig. 4.—
Relationships between the numbers of uptake sequences in genes and protein sequence similarity. Blue, H. influenzae; orange, N. meningitidis. (A) Mean number of uptake sequences per gene for genes with homologs in all three comparison genomes grouped by pairwise percent identity to each homolog. The numbers above the bars are the numbers of alignments in each category. (B) Mean number of uptake sequences per gene versus the number of comparison genomes having homologs. The numbers above the bars are the numbers of genes in each category.

