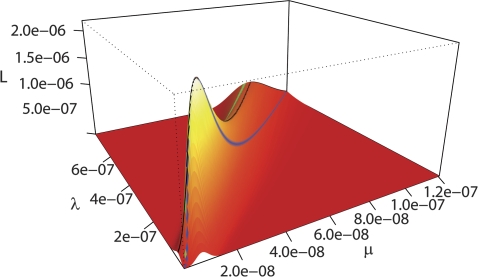
FIG. 2.—
Likelihood surface of the model for binding site for CBF1 in the fungal data set. The likelihood is plotted as a function of the origination rate λ and the decay rate μ of the binding sites. The likelihood function has a distinct maximum with an extended ridge (black) between the λ/μ rate corresponding to the mean binding site number (green) and the λ/μ rate corresponding to the λ/μ rate at the likelihood maximum (blue).

