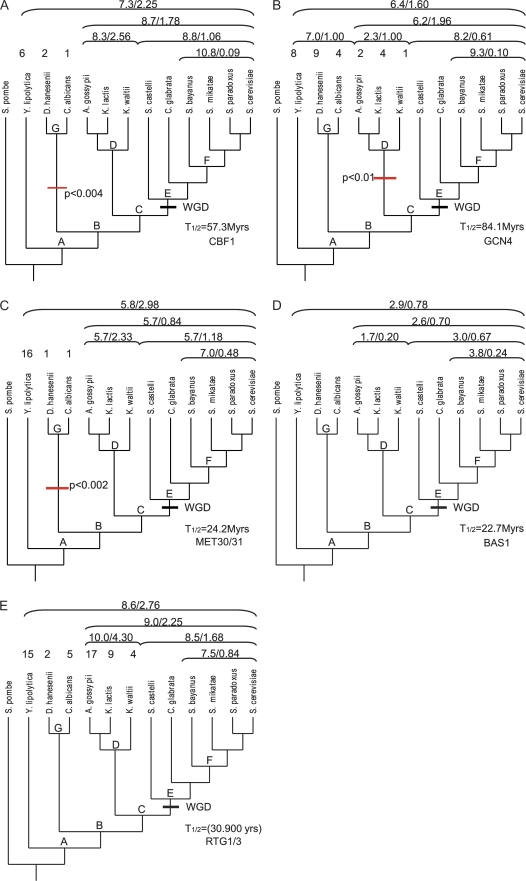
FIG. 8.—
Evolution of binding site number for transcription factors in the methionine pathway of yeast. Clades are marked by a letter at their root and a bracket with the mean binding site number and the V/m ratio above the corresponding species names. For some species the binding site numbers are also given above the name. The whole-genome duplication of the E clade is marked by WGD. For CBF1 (A), the likelihood model estimates a half-life of 57.3 My. There also seems to be a significant decrease in the binding site density in stem lineage of the G clade. GCN4 (B) has with 84.1 My, the longest estimated half-life and a significant loss of binding sites in the D clade. MET30/31 (C) has an estimated half-life of 24.2 My and like CBF1 a significant binding site loss in the G clade. BAS1 (D) has an estimated half-life of 22.7 My. RTG1/3 (E) has in the F clade a V/m ratio close to 1 (0.84), suggesting equilibrium within the 20 Mio years time frame of the F clade. This makes the estimation of the rate parameters difficult and yields to the shortest half-life of only 30.900 years.

