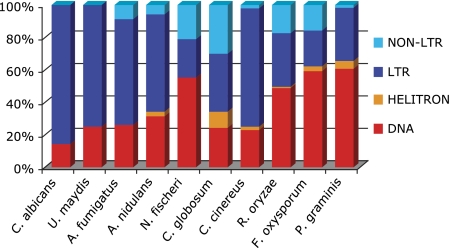
FIG. 5.—
TE composition profiles generated by REPCLASS for 10 fungal genomes. The species are ranked by increasing genome size from left to right. For taxonomic information, see table 2 and supplementary table 1 (Supplementary Material online), and for a phylogenetic relationships, see Fitzpatrick et al. (2006).

