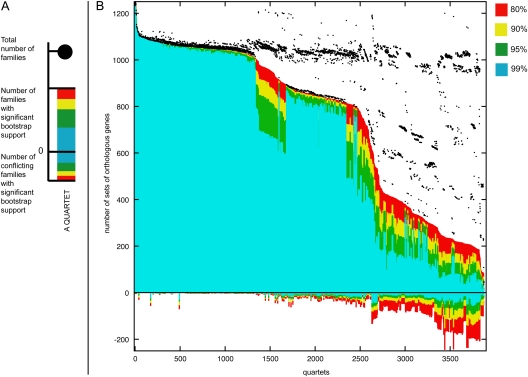
FIG. 2.—
Quartet decomposition analysis of 19 Prochlorococcus and marine Synechococcus genomes (cf., table 1). (A) A single component of quartet decomposition analysis (for more details on methodology, see Zhaxybayeva et al. 2006). Each embedded quartet is represented by a vertical bar and a black dot. The black dot indicates how many data sets contain this embedded quartet. The vertical bar shows the number of data sets having the topology of the quartet that is supported by a plurality of gene families (value above zero) and the number of data sets having one of the other two quartet topologies (value below zero). The bar is color coded with respect to bootstrap support. (B) The quartet spectrum of 1,812 gene families. Columns are sorted according to the number of supporting data sets with at least 80% bootstrap support. Quartets with a very short internal branch or very long external branches as well as those resolved by less than 30% of gene families were excluded from the analyses to minimize artifacts of phylogenetic reconstruction. Quartets above the x axis are combined into a plurality signal (see fig. 1A). Quartets below the x axis are embedded into 932 unique gene families. Note that for every quartet, at least one gene family is in conflict with the quartet topology supported by the plurality.

