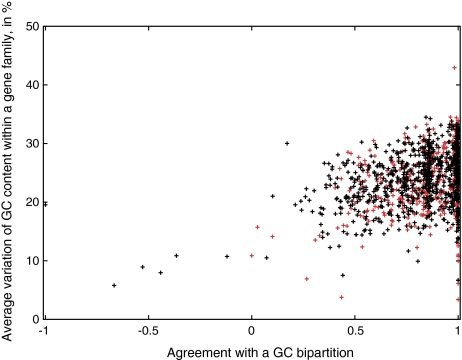
FIG. 5.—
Correlation between GC content observed within each gene family and their agreement with GC bipartition. The genomes were divided into two groups of higher and lower GC genomes (see table 1). A total of 1,271 gene families without paralogs contained at least two genomes of lower and higher GC content and were used in the analyses. GC variation within each family was calculated as average GC variation between each pair of lower–higher GC genes. Agreement with GC bipartition was calculated as described in Materials and Methods. Red crosses refer to all gene families, whereas black crosses indicate gene families that conflict plurality topology. Under the assumption that the observed plurality topology relationships are influenced by GC bias, one would expect a strong correlation. In contrast, the observed trend line of y = 8.1929x + 17.065 is only weakly supported by data (r2 = 0.1232).

