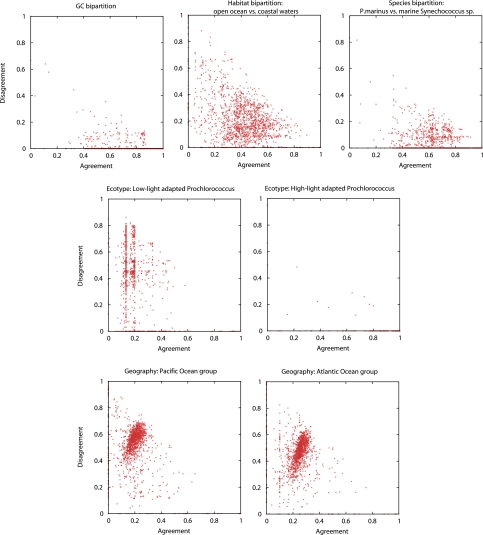
FIG. 6.—
Scatter plots of agreement of individual gene families with selected data partitions (see graph titles). Each gene family is represented by a red dot. The position of the dot within an xy coordinate system depends on how many embedded quartets within gene family agree with the data partition (x value) and how many disagree (y value). Gene families with poor phylogenetic signal will be close to (0,0). The scatter plots observed for random data partitions are shown in supplementary figure 11 (Supplementary Material online).

