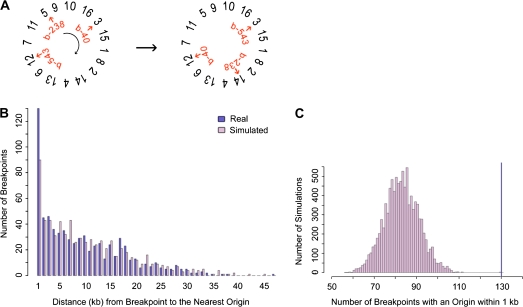
FIG. 2.—
The simulation method. (A) To randomly place breakpoints in the genome, breakpoints (b-238, b-40, etc.) were shifted a random number of intergenic regions over a randomly ordered set of concatenated chromosomes. In this example, break b-238 moves from chromosome V to chromosome XIV. (B) With the set of real and simulated breakpoints, the distance to the nearest genomic feature was found. In this example the distances to the nearest hcARS were plotted for one simulated set of Wolfe breakpoints using minimal end point measures. We noted that for ARSs/origins, tRNAs, Tys, and LTRs, the number of breakpoints with a genomic feature within 1 kb was greater for the real set of breakpoints than for the random set of breakpoints. (C) For 10,000 simulations, the number of breakpoints with a feature within 1 kb was counted. This distribution was used to obtain a significance value for the number of real breakpoints with the feature within 1 kb (dark-blue line). The significance value was found by summing the number of simulations where the number of breakpoints with the feature within 1 kb was greater than or equal to the real data (dark-blue line). The distribution and real data are shown for Wolfe breakpoints and hcARSs using the minimal end point measures. The data for this example produce a P value of 0.0002. The complete data for all genomic features are shown in supplementary table S7 (Supplementary Material online).

