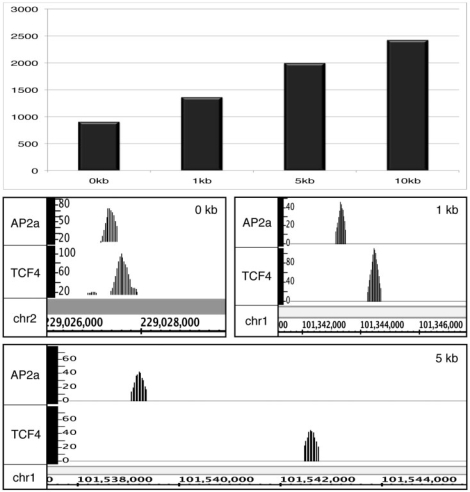
Figure 8.
Using the Sole-Search Tool set to identify enhanceosomes. A location analysis of the 17 118 AP2α peaks and 21 102 TCF4 peaks was performed using the Location-Analysis Tool. The 6272 AP2α and 6682 TCF4 enhancer sites (defined as ±10 to 100 kb from the start site of a gene) were then compared using the Overlap Tool. The number of sites identified when the spacing between TCF4 and AP2α sites was varied between 0 kb (peaks must overlap) to 10 kb is shown in the top panel. Also shown are examples of AP2α and TCF4 peaks, all of them far from start sites of genes, that overlap by 0, <1 kb or <5 kb.

