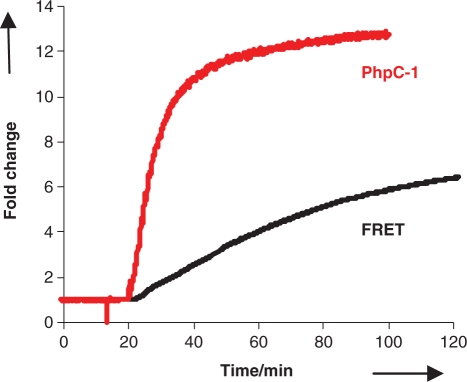
Figure 4.
Comparison the change in fluorescence emission intensity for the PhpC-1 RNase H assay (red curve) compared to the classic Fluorescein/Dabcyl assay (black curve). Both substrates were treated with HIV-1 RT RNase H activity simultaneously in identical conditions at a concentration of 1 µM scanning at the λmax excitation and emission for both fluorescein (485/520 nm) and PhpC (360/465 nm).

