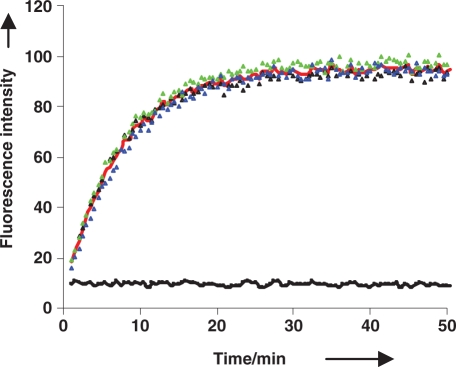
Figure 6.
Fluorescence HIV-1 RT RNase H assay of 1 µM PhpC-1:DNA-1 monitored by a 96-well plate spectrofluorimeter. Colored triangles represent reactions in three individual wells, with the red curve representing their average. The average of three controls without enzyme is represented by the black curve.

