Figure 6.
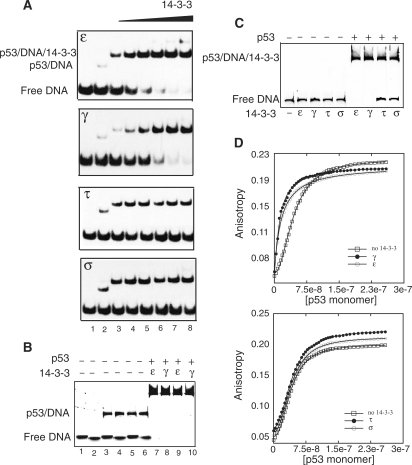
Effect of 14-3-3 on DNA binding of p53. (A) EMSA experiments carried out with the 14-3-3 isoforms are shown in separate panels. Lane 1: only DNA (8 µM), lane 2-8: p53 (8 µM) and increasing amounts of 14-3-3 (0, 2, 4, 8, 10, 15, 20 µM, respectively). γ and ε isoforms showed enhancement of the p53-DNA band with the free DNA band decreasing in intensity. A 27 bp containing p21 response element was used. (B) Sequence-specific DNA binding was observed across 40 bp and 55 bp DNA containing p53 response element. Lanes 1, 3, 5, 7, 9 and lanes 2, 4, 6, 8, 10 were loaded with 40 bp and 55 bp, respectively. In the presence of 14-3-3 ε and γ (20 µM: Lanes 7–10), the band is supershifted, and the free DNA band has disappeared. (C) Control experiment showing no complex formation of 14-3-3 and DNA occurs in the absence of p53. When p53 is present, ε and γ but not τ and σ enhance the sequence-specific DNA binding of p53. (D) Binding titration profiles of p53 to p21 response element labeled with fluorescein at 5′-end in the absence and presence of 14-3-3 respectively. The data fitting was done using Hill equation, [p53]h / (kdh/ [p53]h). ε and γ showed a decrease in cooperative DNA binding of p53, while τ and σ had no pronounced effect.

