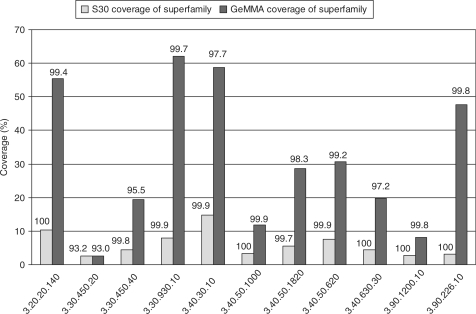
Figure 10.
Comparative modelling coverage of 11 superfamilies of predicted CATH domains chosen for structural genomics target selection by the Midwest Center for Structural Genomics. Coverage achieved within GeMMA subfamilies is compared to that within Gene3D S30 clusters (multi-linkage clusters at 30% sequence identity). The numbers above the columns are the percentage of good models as determined using the GA341 score incorporated in Modeller.

