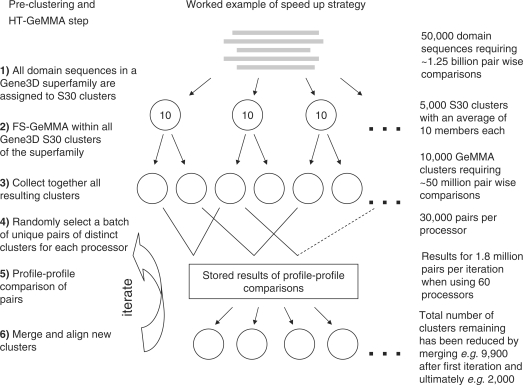
Figure 11.
Illustration of the strategy employed to speed up HT-GeMMA. This uses a worked example described in the ‘Appendix’ section. Steps in the HT-GeMMA method are listed on the left and may be identified in the flow chart giving an overview of the method in Figure 2.

