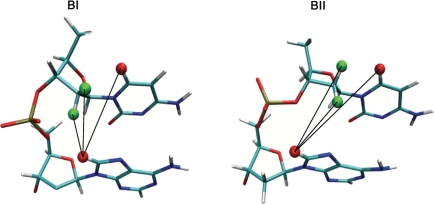
Figure 1.
Illustration of the internucleotide distances ds(H2′), ds(H2′′) and ds(H6/8) inferred from δP values. These distances depend on the phosphate linkage conformations, BI (left) or BII (right), as shown with a CpA dinucleotide. The black lines depict the internucleotide distances between H8 of the adenine (red) and H2′/H2′′ (green) or H6 (red) of the cytosine.

