Figure 2.
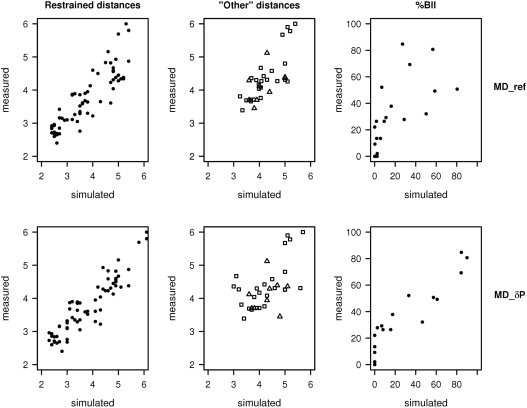
Plots of simulated versus measured distances and BII populations. Measured internucleotide distances (Å) and BII populations (in percent) in the Jun-Fos oligomer were extracted from NOESY cross-peaks and from δP, respectively. These observables are compared to their simulated counterpart, whether obtained with a conventional refinement protocol (MD_ref) or with the new δP-based method (MD_δP). The NOE distances are divided into a group restrained in all MDs [ds(H2′), ds(H2′′) and ds(H6/8)] (leftmost panels) and the ‘Other’ distances restrained in MD_ref but not in MD_δP (middle panels). In ‘Other’ distances, H2i-H1′i+1 and H2′/2′′i-H5i+1 correspond to symbols Δ, and H1′i-H6/8i+1 and H1′i-H4′i+1 to symbols □.

