Figure 2.
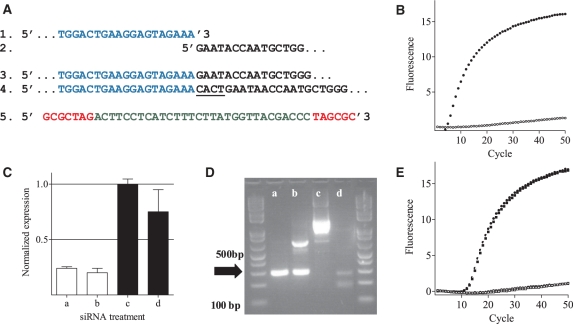
Specific detection of mRNA cleavage products with MBRACE in vitro. (A) Schematic representation of sequences of: (1) the RNA linker (blue); (2) ApoB cleavage site; (3) positive (RNA linker ligated to cleavage product) and (4) negative (4 bp insertion between linker and mRNA fragment underlined) clones; and (5) the molecular beacon probe used to detect linker ligation to the cleaved mRNA fragment (red text represents the 7-bp stem). (B) Amplification curves showing fluorescent signal generated from positive (filled square) and negative (open square) cDNA clones. (C) RT–qPCR analysis of ApoB mRNA in Hepa1-6 cells transfected with either 1 (a) or 10nM (b) ApoB-1 siRNA, or 1 (c) or 10 nM (d) mismatch control siRNA. (D) The same samples were used as template in standard 5′-RLM-RACE analysis, and analyzed by electrophoresis. The correct product indicated by the arrow has a size of 290 bp. (E) Amplification curves from MBRACE reactions using the template from siRNA-treated cells as in (C) filled symbols represent samples transfected with ApoB-1 siRNA, and open symbols are samples transfected with mismatch control siRNA at 10nM (open square) or 1nM (open triangle). All MBRACE experiments were performed in duplicate, but for clarity only a single, representative replicate is shown.

