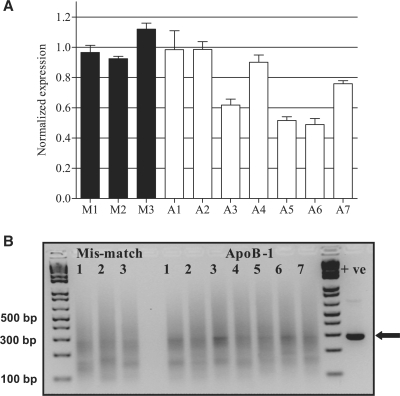
Figure 4.
ApoB knockdown and detection of mRNA cleavage products in mouse liver. (A) qRT–PCR of ApoB mRNA levels from the livers of mice treated with ApoB-1 siRNA or a mis-matched control siRNA by the HTVI method. Levels of ApoB mRNA were normalised to the average of the mis-match siRNA samples. (B) Standard 5′-RLM-RACE of the same samples, analyzed by electrophoresis on a 3% TAE-agarose gel using 1 kb Plus ladder (Invitrogen). An in vitro positive control (+ve) was prepared and analyzed in parallel; the band of correct size (290 bp) is indicated with an arrow.

