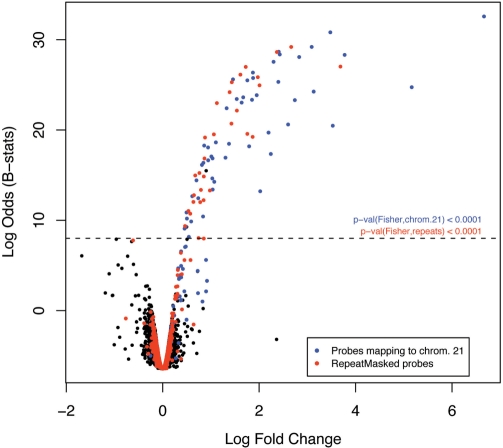
Figure 4.
Effect of repetitive sequences on gene expression measurements. Volcano plot (y-axis: empirical Bayes log-odds of differential expression; x-axis: log2 fold change in expression) comparing the expression of human transcripts in livers between Tc1 mice carrying a human chromosome 21 and their wild-type litter-mates (Tc0). Blue dots depict probes targeting genes on human chromosome 21 and red dots probes comprising human RepeatMasker sequences. The dashed line is an arbitrary cut-off for differential expression based on the assumption that there are no human sequences transcribed in the wild-type mouse and, therefore, no human transcript should be overexpressed in Tc0. The P-values (Fisher’s exact test) show that the numbers of differentially expressed transcripts from human chromosome 21 (blue) and comprising human repeats (red) are both highly significant.

