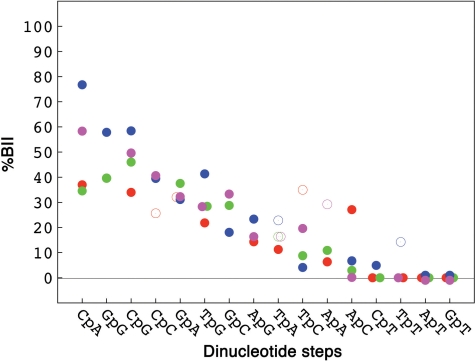
Figure 3.
Influence of the tetranucleotide sequence on the BII percentages of the central phosphate group. BII percentages (%BII), compiled and translated from δP values published in the literature (see ‘Materials and Methods’ section and Supplementary Table S1), are given for the dinucleotide steps in four different tetranucleotide contexts: R–R in green, R–Y in red, Y–R in blue and Y–Y in magenta. Categories that contain more or less than three cases are represented by filled and open circles, respectively.

