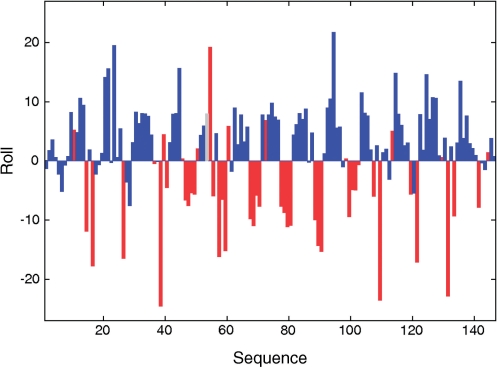
Figure 5.
Relationship between roll and backbone conformations in NCP X-ray structures. Roll (°) profile along the DNA sequence in nucleosome X-ray structure 1KX5. The bars giving the roll values are colored according to the state of the facing phosphates in the complementary dinucleotide steps: blue for BI•BI and red for BI•BII or BII•BII. The grey bar represents an unclassifiable step (BI on strand 1 and (ε − ζ) ∼ 170°, i.e. neither BI nor BII, on strand 2). Structures 1KX3 and 1M19 give similar patterns.

