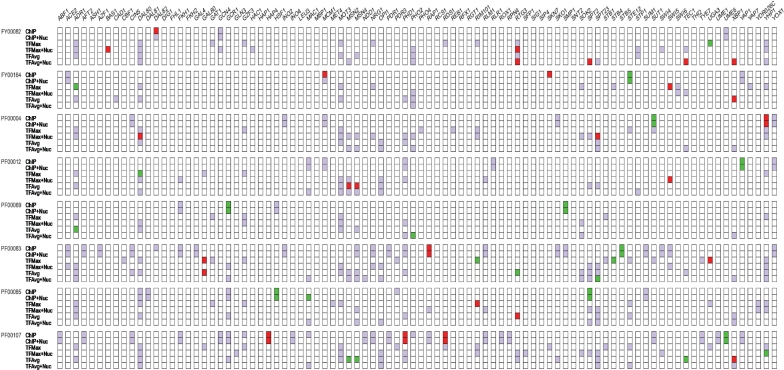
Figure 2.
Summary of results for all families. Each column in the grid corresponds to a specific TF. Rows are grouped into families, and for a family, each row represents the measure used for determining the TF-binding score. If a TF does not bind to the promoter of any gene in the family according to the corresponding binding score measure in the row, then the corresponding cell is white; these were excluded from analysis. All other cells correspond to analyzed TF–family pairs. A purple cell indicates that we did not detect a significant correlation between binding probability and expression divergence in any sample. A red or green cell indicates that we found a significant negative or positive correlation, respectively, between binding probability divergence and expression divergence in at least one sample. See text for the thresholds used to determine significance. Only families having at least one significant gene family–TF interaction are shown.


