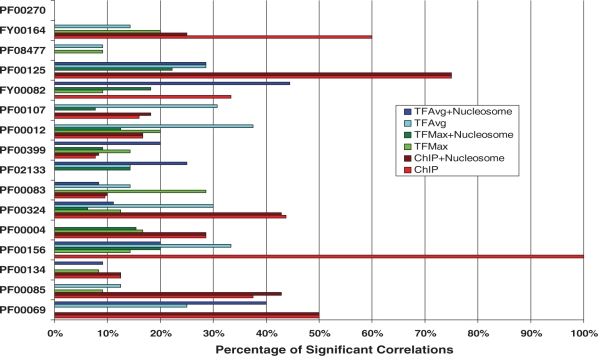
Figure 3.
Summary of significant correlations between TF-binding scores and expression in TF–family pairs. The families shown on the y-axis of the bar plot are listed in decreasing order from top to bottom of average protein similarity of the genes in the family. For instance, PF00270 has the highest average protein similarity of genes, and PF00069 has the lowest. The x-axis shows the percentage of significant correlations between TF-binding scores and expression in putative TF–family pairs, for the three different TF-binding probability metrics, both with and without nucleosome occupancy information.

