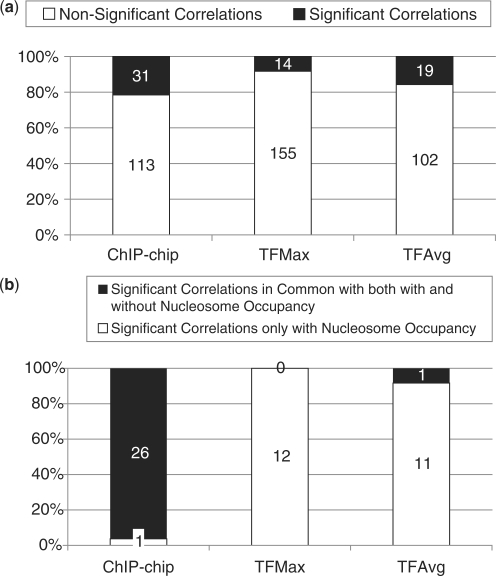
Figure 4.
(a) Stacked bar plot showing percentage of correlations in TF-family pairs between TF binding and expression divergence for putative TF binding sites identified by three different measures of binding probabilities: ChIP-chip, TFAvg and TFMax. The shaded (unshaded) area indicates the number of significant (non-significant) correlations. See text for definitions of significance. (b) Effect of using nucleosome occupancy information with respect to significant correlations between TF binding and expression divergence for three different measures of binding probability: ChIP-chip TFMax and TFAvg. The plot shows for each metric, the total number of significant correlations (red) detected if we use the TF metric with the nucleosome occupancy information as well as the number of significant family–TF pairs common (green) in the case of using the TF-binding metric without the nucleosome occupancy information.

