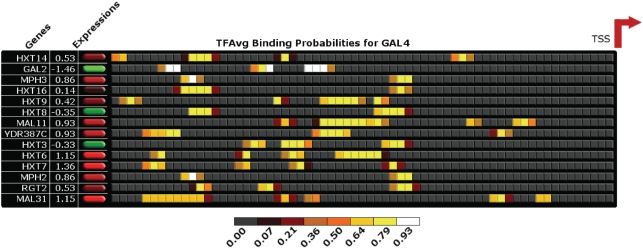
Figure 6.
Correlation between GAL4 binding and expression in the sugar transport family, PF00083. The figure shows a schematic of putative GAL4 binding in the multiple alignment of the promoters of sugar transporters (locations are in scale but approximate), and the corresponding expressions of the genes in a sample cluster corresponding to GSM29914. The transcription start site (TSS) is indicated by the red arrow. The putative binding sites are categorized by percentile scores. In general, highly expressed genes (shown in green shades) have a greater number of strong binding sites.

