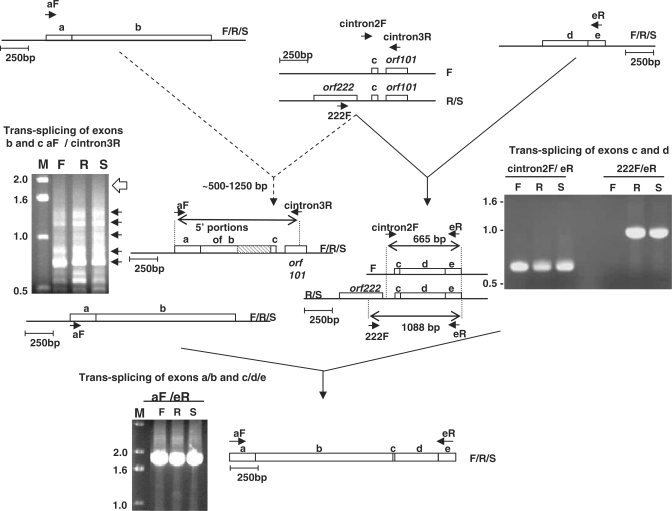
Figure 2.
Trans-splicing and mis-splicing of Brassica nad5 transcripts. Top left: RT–PCR products generated using primers from exon a (aF) and intron nad5Ti3L/orf101 (cintron3R). Blunt ends of arrows indicate complementary sites within the corresponding transcripts. Dotted arrows on pathway 1 indicate mis-splicing. F, R and S indicate fertile, sterile and restored lines. The open arrow to the right of the gel photograph on the left indicates the position expected of an intact exon b correctly spliced to exon c. The arrows to the right of the gel image indicate the locations of individually excised, cloned and sequenced bands. The diagram to the right of the gel depicts the general structure of the mis-spliced products; the hatched box is used indicate the sections of exon b that are not present in the mis-spliced products. Top right: RT–PCR products generated using primers from exon e (eR) and intron nad5Ti2R (cintron2F) or orf222 (222F). The diagram to the right of the gel photograph indicates the sizes and structures of the products determined by excision, cloning and sequencing. Bottom: product generated from fully trans-spliced nad5 mRNA using primers from exons a and c.

