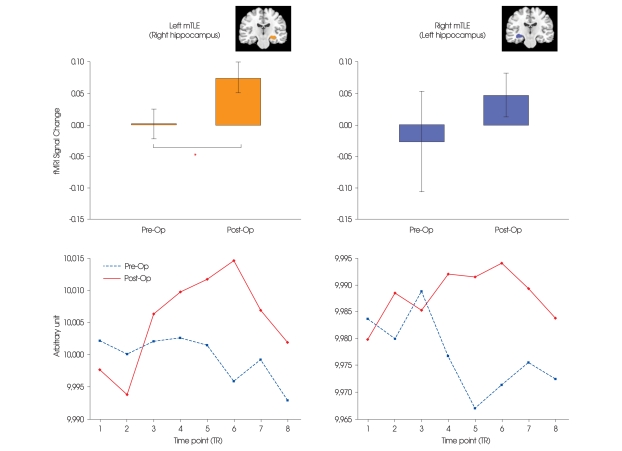
Fig. 3.
Semantic-related hippocampus profile, which is contralateral to the epilepsy lesion. A : Percent signal change in the hippocampus within the semantic related network. B : Average time profiles of the hippocampus during word generation task. The individual blocks of the word generation task have been averaged into a representative time series. The values are in arbitrary units. Blue dotted line represents average time series during pre-operative session, and red solid line during post-operative session. *p < 0.05.

