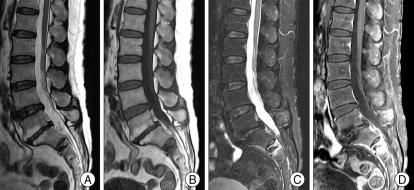
Fig. 3.
Magnetic Resonance Images show abnormal signal intensities on the second sacral body. This lesion shows low signal intensity on T2-weighted image (A), low signal intensity and surrounding bone edema on T1-weighted image (B), high signal intensity on fat-suppression T2-weighted image (C) and highly enhanced after gadolinium infusion(D).

