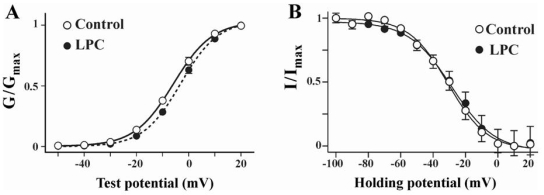
Fig. 2.
Steady state activation and inactivation curves of ICa(L) obtained before and after LPC application. (A) Steady state activation curves of ICa(L) in control and LPC. Chord conductance (G) was measured at different membrane potentials and normalized to the maximal chord conductance (Gmax). Each data points were the means of 8 experiments and fitted using a following form of Boltzman equation; Y={1+exp[(V1/2 - V)/k]}-1, where V1/2 represents half maximal activation potential and k is slope factor. Measured V1/2 was -5.8±0.2 mV and -3.1±0.1 mV in control and LPC, respectively. (B) Steady state inactivation curves of ICa(L) in control and LPC. Current amplitudes (I) of test potential to 0 mV from different pretest potentials were normalized to the maximal current (Imax). Each data points were the means of 6 experiments. Curves were obtained from following form of Boltzman equation; Y={1+exp[(V - V1/2)/k]}-1, where V1/2 represents half maximal inactivation potential and k is slope factor. V1/2 was -31.4±1.2 mV and -30.2±1.6 mV in control and LPC, respectively.

