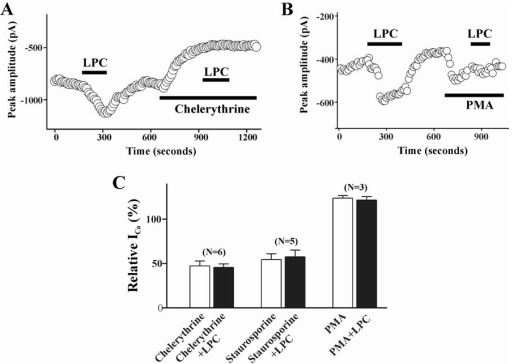
Fig. 3.
Effect of PKC on LPC-induced change of ICa(L). Plot of Ca2+ currents evoked by repetitive step depolarization from -80 mV to 0 mV versus time. Temporal course of change of ICa(L) during treatment of LPC (1 µM) alone and LPC with 3 µM chelerythrine (A), or with 100 nM PMA (B). Horizontal bars indicate the time of drugs application. (C) Summary of the effect of pretreatment of staurosporine (100 nM), chelerythrine (3 µM), and PMA (100 nM) on LPC-induced change of ICa(L). Data are expressed as the % of control. Number of cells in each experimental condition is indicated in parenthesis.

